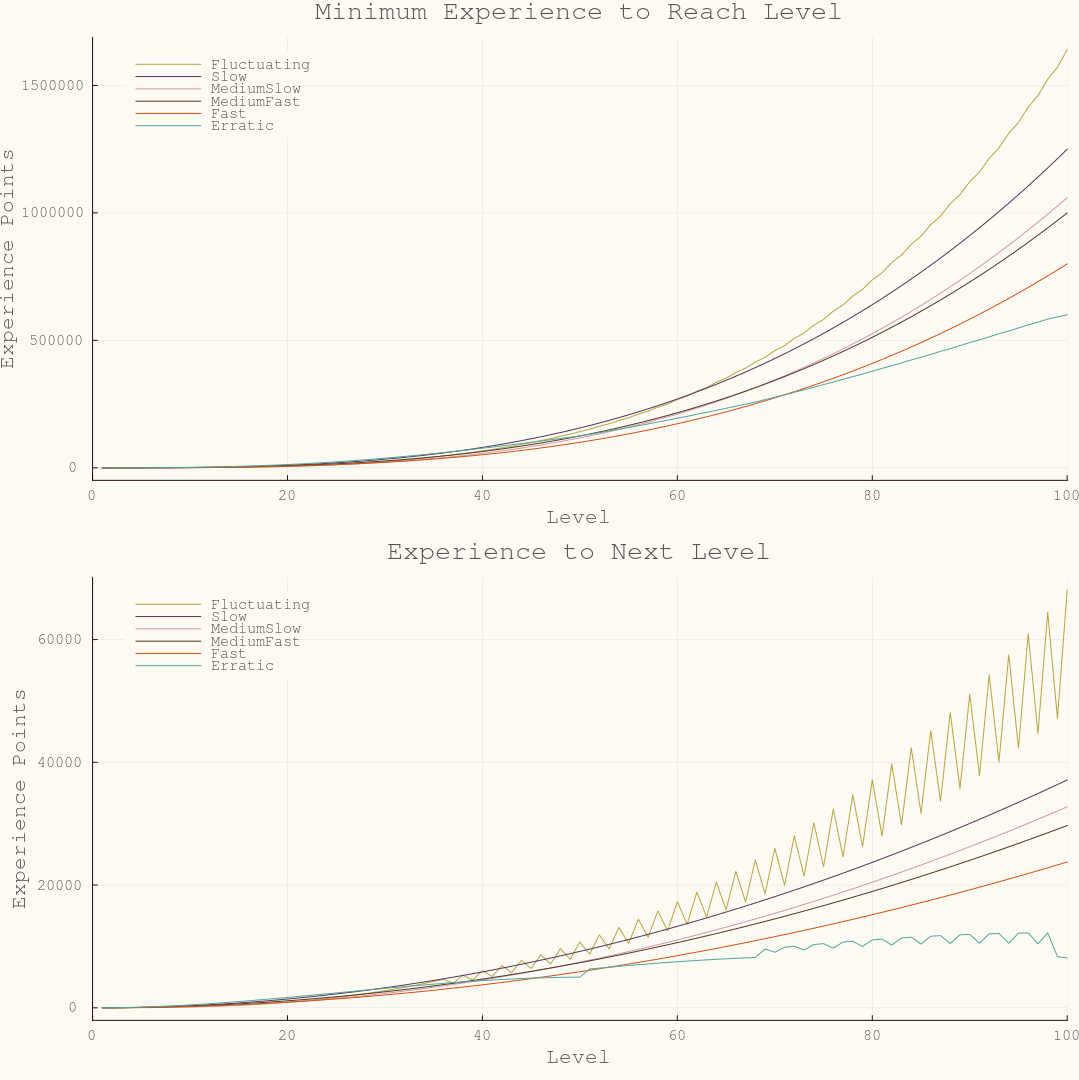
I have been experimenting with Plots.jl and I have also been binging videos of solo Pokémon playthroughs from Scott’s Thoughts. The different rate at which Pokémon gain experience is one of the largest differences in how long it will take to complete a playthrough. Pokémon are divided into six level-up groups: fluctuating, slow, medium slow, medium fast, fast, and erratic. The graphs below show how these groups vary as level increases.
While analyzing the math behind Pokémon is fun - and will likely result in more blog posts here or over at GottaCatchEmAll.jl - the rest of this post will focus on the Julia code to create the previous graphs.
First up, let’s define an enum to represent the different groups.
@enum Group begin
    Fluctuating
    Slow
    MediumSlow
    MediumFast
    Fast
    Erratic
end
The level-up groups are defined as functions of the target level. So we need a function which accepts the level and group and returns the required experience - exp(l::Int, g::Group)::Int. The obvious structure for exp is to branch on g. We could write that directly as a series of if, elseif, else statements. Or we could take advantage of Julia’s type system to handle the branching for us. Using value types we can define separate functions for each enum variant. This is potentially a performance challenge12. Tread lightly when using this in production, but irrelevant for this example.
Onward to defining exp. Here is the primary entry point allowing users to type exp(8, MediumFast). While not required this is a more approachable interface that hides the internal/Julia-specific implementation details.
exp(l::Int, g::Group) = exp(l, Val(g))
Each of these functions will have a similar type signature and will have to use max and floor to handle edge cases and converting to integers. Let’s define a macro to handle this repetition.
macro exp(group, eq)
    eval(quote
             exp(l::Int, ::Val{$group})::Int = max(0, floor($eq))
         end)
end
With the enum and macro we can now simply type the mathematical function definitions for each group. These were sourced from Bulbapedia and pokered.
@exp(Fast, 4l^3/5)
@exp(MediumFast, l^3)
@exp(MediumSlow, 6l^3/5 - 15l^2 + 100l - 140)
@exp(Slow, 5l^3/4)
@exp(Fluctuating, begin
         if l < 15
             l^3*(floor((l+1)/3) + 24)/50
         elseif l < 36
             l^3*(l+14)/50
         else
             l^3*(floor(l/2)+32)/50
         end
     end)
@exp(Erratic, begin
         if l < 50
             l^3*(100-l)/50
         elseif l < 68
             l^3*(150-l)/100
         elseif l < 98
             l^3*floor((1911-10l)/3)/500
         else
             l^3*(160-l)/100
         end
     end)
Now we define some colors to match this website. I opted to use hex notation and divide by 0xff to directly match the css statements. Least mental overhead while not the prettiest.
const darksienna = RGB(0x23/0xff, 0x0c/0xff, 0x0f/0xff)
const antiquewhitelight = RGB(0xfd/0xff, 0xf9/0xff, 0xf3/0xff)
const brass = RGB(0xb5/0xff, 0xa6/0xff, 0x42/0xff)
const cafenoir = RGB(0x4e/0xff, 0x38/0xff, 0x22/0xff)
const flame = RGB(0xd4/0xff, 0x51/0xff, 0x13/0xff)
const polishedpine = RGB(0x4e/0xff, 0xa6/0xff, 0x99/0xff)
const englishviolet = RGB(0x51/0xff, 0x35/0xff, 0x5a/0xff)
const puce = RGB(0xd4/0xff, 0x96/0xff, 0xa7/0xff)

const seriescolors = [brass,
                      englishviolet,
                      puce,
                      cafenoir,
                      flame,
                      polishedpine]
Plotting the total experience to reach a given level. Data is tracked as a single number and level is computed from total experience gained. Functional programming ftw! Bonus points for ∈ as a unicode character in the list comprehension and |> to reduce cognitive overhead of function composition.
function plotcumulative()
    p = plot(; xlims=(0, 100),
               fontfamily="monospace",
               title="Minimum Experience to Reach Level",
               xlabel="Level",
               ylabel="Experience Points",
               formatter=:plain,
               legend_foreground_color=nothing,
               size=(1080, 540))

    for (i, g) in Group |> instances |> enumerate
        plot!(p,
              [exp(l, g) for l ∈ 1:100];
              color=seriescolors[i],
              label="$g")
    end

    p
end
How much experience to get to the next level? Just take the difference.
function plotdelta()
    p = plot(; xlims=(0, 100),
               fontfamily="monospace",
               title="Experience to Next Level",
               xlabel="Level",
               ylabel="Experience Points",
               formatter=:plain,
               legend_foreground_color=nothing,
               size=(1080, 540))
    for (i, g) in Group |> instances |> enumerate
        plot!(p,
              [exp(l, g) - exp(l-1, g) for l ∈ 1:100];
              color=seriescolors[i],
              label="$g")
    end
    p
end
And finally, merge the two plots together into a single image.
function plotall()
    savefig(plot(plotcumulative(),
                 plotdelta();
                 layout=(2,1),
                 fontfamily="monospace",
                 bgcolor=antiquewhitelight,
                 fgcolor=darksienna,
                 size=(1080,1080)),
            "exp.png")
    nothing
end
The full source code can be found here: PokemonExperience.jl.